


This tool calculates distances between sets of source and target points (either on or close to the network).
To use this utility first load a line layer with a network topology. Also add the point layers containing the origins and destinations.
If the network topology has already been created for the line layer then select the Load topology from previously generated network option from the Network menu, otherwise select Network|Generate network topology to create the topology.
To open the tool select Origin-Destination Matrix from the Network menu.
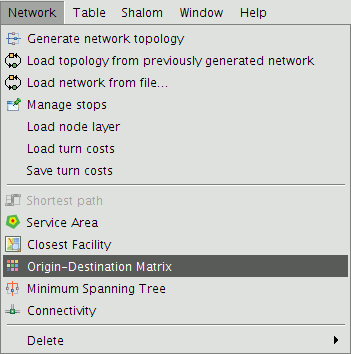
O-D Matrix tool on the Network menu
This opens the following form:
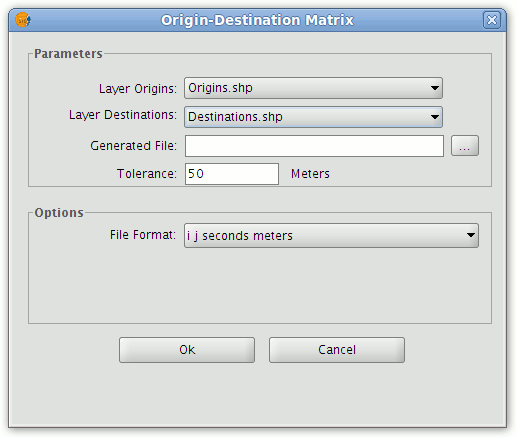
Form for configuring the matrix calculation
In the Parameters section select the point layers in the ToC that represent the origins and destinations. Also specify a path and name for the output text file that will be generated. The tolerance parameter can also be set.
NOTE: The origin and destination points used in the calculation need not be located on the network segments. To allow for this, the tolerance parameter is used to define the maximum distance between the points and the nearest network segment. If the distance between a point and the nearest network segment is greater than the tolerance then this point will be excluded from the calculation.
Click Ok to generate the output file, which shows the results in matrix form.
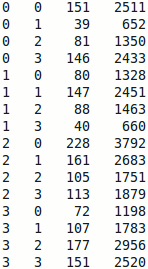
Text file showing the O-D Matrix costs and distances
The matrix columns correspond to:
- Source node index.
- Destination node index.
- Seconds between the O-D nodes.
- Distance between the O-D nodes.
NOTE: If the location of the origins is the same as the destinations, the matrix will be square and the diagonal will be zero. If two points are not connected, the matrix value will be -1. To change the speed used for calculating the time between O-D nodes (in seconds, minutes, etc.) use the Set speeds button in the Route control panel.
To visualise the calculated distances, open the Route control panel, load stops representing the origin and destination points, and manually set one of them as the destination. It is also possible to activate stops in pairs (origin and destination) and then calculate the routes between them. In this way the results of the O-D matrix may be visualised.
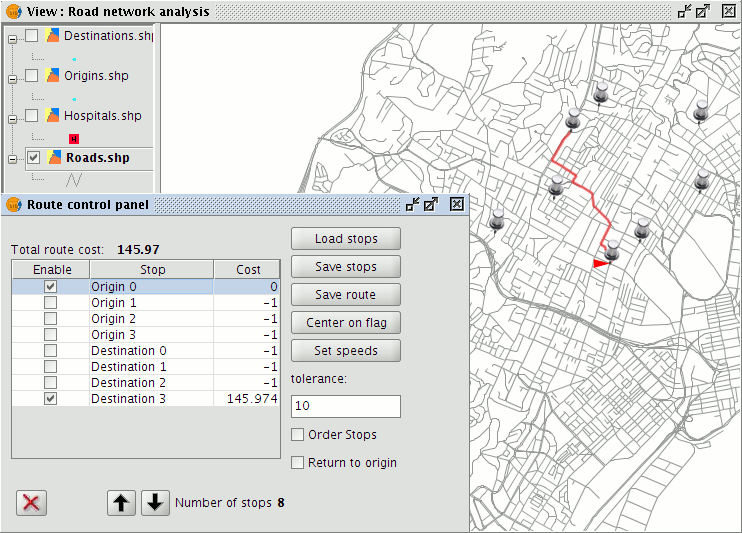
Graphical display of the results


